This is the 4th simulator of 4 developed at Universidade de Aveiro at the course 47064 - Network Performance and Dimension in which is is addressed the issue of resource management in network systems and introduce the main techniques of performance analysis and design (stochastic modeling and simulation of discrete events).
The available developed simulator tool set is the following:
- Simulator 1: Connectivity performance of multi-hop wireless networks with mobile terminals
- Simulator 2: Impact of transmission errors in network performance
- Simulator 3: Blocking performance of video-streaming services
- Simulator 4: (this project) Traffic Engineering of packet switched networks
All simulators run both in Matlab or Octave.
The aim of this simulator is to address the traffic engineering of an ISP (Internet Service Provider) core network based on MPLS (Multi-Protocol Label Switching). For a given network and a given set of estimated traffic flows to be supported, the traffic engineering task addressed in this assignment is to select a routing path for the LSP (Label Switched Path) of each traffic flow such that the performance of the network is optimized. The network performance is assessed by the Kleinrock approximation.
The Kleinrock approximation assumes that each network link behaves as a M/M/1 queuing system. It is considered a network composed by a set of unidirectional links (i,j), each one with a capacity μ_ij (in packets/second) and a propagation delay d_ij (in seconds). The network supports S packet flows s = 1,...S, each one with a packet arrival rate λs (in packets/second) and a routing path composed by the links (i,j) defined in set Rs. The total arrival rate on connection (i,j) is:
and the total traffic supported by the network is:
Then, by the Kleinrock approximation, the network average delay is:
and the average delay of each flow s is:
In this scenario there's a MPLS (Multi-Protocol Label Switching) network of an ISP (Internet Service Provider) with the topology presented in figure below, where the gray nodes are transit nodes (they just provide connectivity between the other nodes), thick connections have a bandwidth capacity of 10 Gbps and the other connections have a bandwidth capacity of 1 Gbps.

In matrices.m, the R matrix defines the network topology of the above figure, where element R(i,j) gives the capacity (in Gbps) of the connection from node i to node j and L matrix defines the connection lengths (in kilometers) where element L(i,j) indicates the length of the connection, also from node i to node j.
The network must support an estimated traffic matrix, defined by matrix T, where element T(i,j) represent the average traffic bandwidth sent from node i to node j.
For this simulation, all network connections have the propagation delay given by the light speed in optical fiber (2×10E8 meters/second). For all traffic flows the packet arrivals are Poisson processes and the packet sizes are exponentially distributed with an average size of 1000 Bytes.
The ISP requires each traffic flow to be routed through a single LSP (Label Switched Path). The LSPs between the same nodes are required to be symmetrical (i.e., the network connections of an LSP from node i to node j must be the same network connections of the LSP from node j to node i).
ShortestPathSym.m provides a function that that, for a given pair of nodes, determines the routing path that minimizes the sum of the connection costs in both directions between them. The function syntax is: function [route]= ShortestPathSym(costs,node1,node2)
Input variables:
| Parameter | Description |
|---|---|
| costs | Square matrix of 17×17 elements where element costs(i,j) defines the cost of the connection from node i to node j |
| node1 | the first end node |
| node2 | the second end node |
NOTES:
- the cost values must be non-negative
- the function ignores the values costs(i,j) for pairs of nodes such that there is no connection in the ISP network (as defined in topology figure)
Output values:
| Parameter | Description |
|---|---|
| route | a row array of 17 elements with the sequence of nodes in the routing path from node1 up to node2 (the remaining elements are zero) |
Error codes:
When the output parameter route is a single element, its content indicates the following error in the input parameters:
| Parameter | Description |
|---|---|
| -1 | the matrix costs is not a square matrix of 17×17 elements |
| -2 | the node1 and/or node2 are either equal or invalid |
| -3 | at least one cost value is negative |
Every simulation example outputs maximum and average for connection load (total bandwidth supported by the connection divided by its bandwidth capacity) and delay (network average round-trip time) among all flows.
Example of a simulation solution_a.m where the criteria to create each route flow is the shortest path between the nodes. The graphs show the flow delays and link loads of the node's connections.

solution_b.m computes the same simulation, but with the criteria minimizing the connection load.

In this example, when compared to *1. Shortest Path" the link loads are lower by sacrificing flow delays.
solution_c.m computes the same simulation but with the criteria of minimizing average round-trip delay.
The results above intend just to provide a simple approach to ISP route design. In the following results it was implemented a Multi-start local search heuristic that, as explained in more details in TrafficEngineeringDDR16_17.pdf, outputs a better result by running multiple n interactions and evaluating each one and by searching for a optimal solution at each iteration.
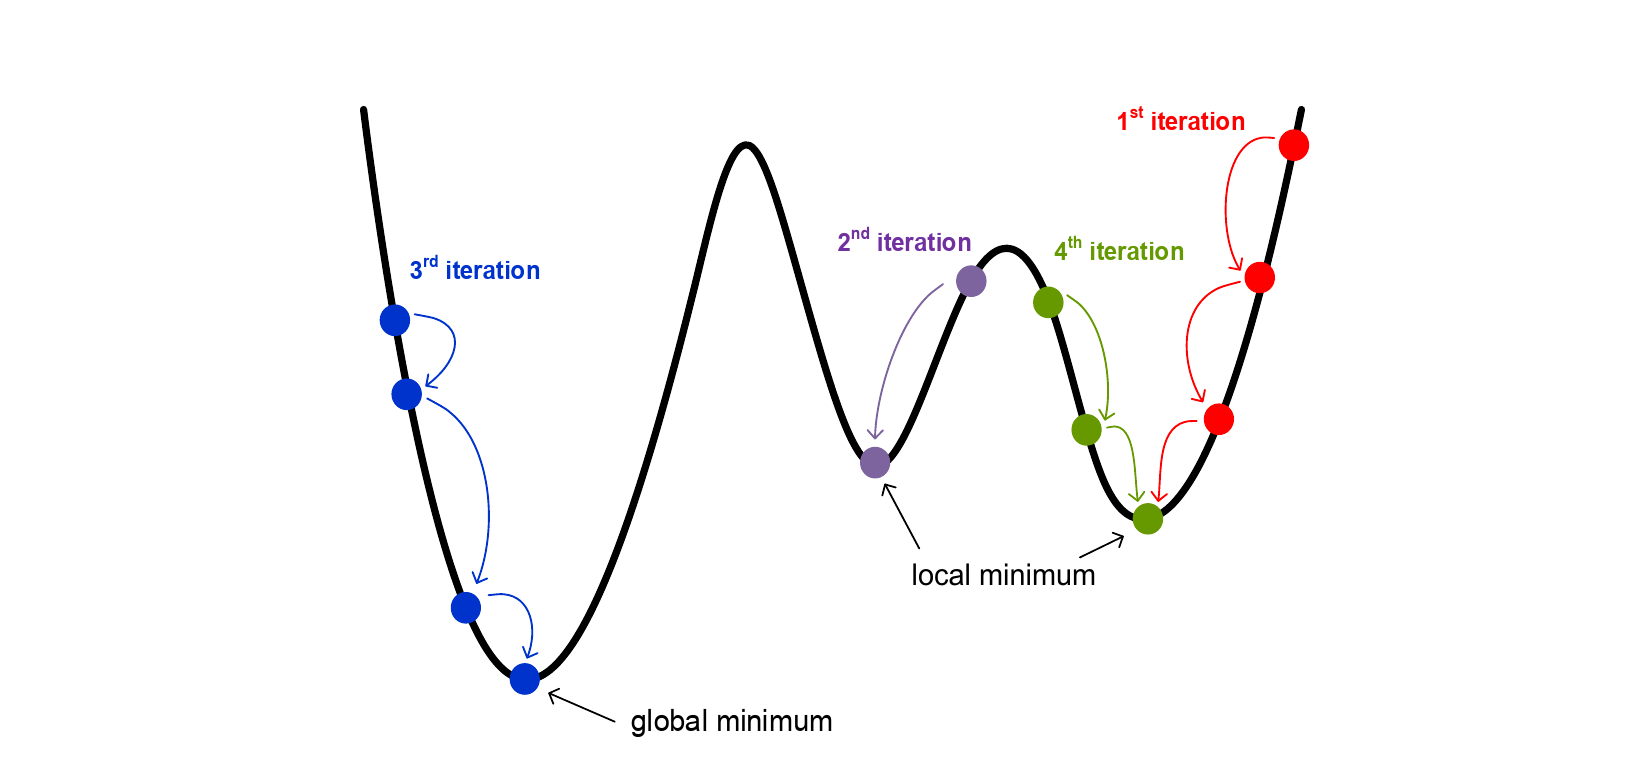
Using MSLS strategy, when running solution_e.m it is possible to compute average global network average round trip delta. Running MSLS across n simulations although it isn't guaranteed that the best solution is found, for the scale of this simulation the number of interactions pre-configured should be enough.
This is probably the most interesting solution since it meets the criteria of having a global lowest maximum connection load, which is what most ISPs try to accomplish. solution_f.m runs this simulation and outputs the results of running MSLS using this criterion as a benchmark. In-line with previous simulations, to accomplish MPLS it also runs for the times as specified by array n.
MIT