This repository contains a practical example about how to use OpenTelemetry to add custom metrics to a .NET app, and how to visualize those metrics using Prometheus and Grafana.
The repository contains the following applications.
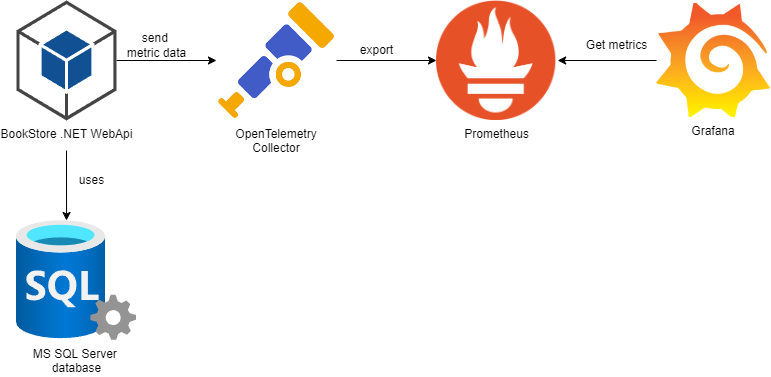
- The BookStore WebAPI uses the OpenTelemetry OTLP exporter package (
OpenTelemetry.Exporter.OpenTelemetryProtocol) to send the metric data to the OpenTelemetry Collector. - The Prometheus server obtains the metric data from the OpenTelemetry Collector.
- The Grafana server comes preconfigured with a few dashboards to visualize the OpenTelemetry metrics emitted by the BookStore WebApi.
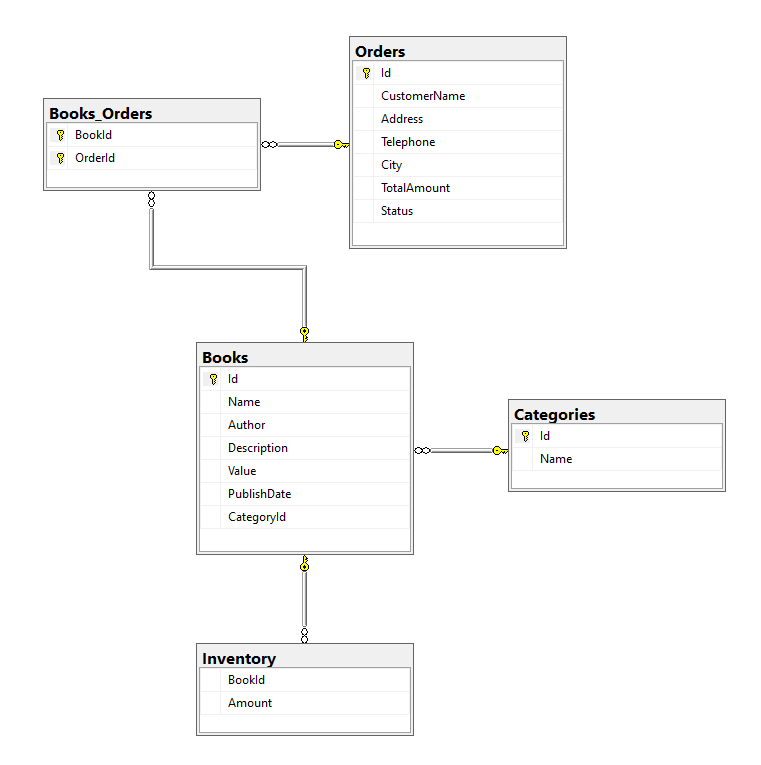
The application is a BookStore API built using .NET 8. It allows us to do the following actions:
- Get, add, update and delete book categories.
- Get, add, update and delete books.
- Get, add, update and delete inventory.
- Get, add and delete orders.
For a better understanding, here's how the database diagram looks like:
The application generates the following metrics:
Those are the business metrics instrumented directly on the application using the Metrics API incorporated into the .NET runtime itself.
The metrics generated are the following ones:
BooksAddedCounter: It counts how many books are added to the store.BooksDeletedCounter: It counts how many books are deleted from the store.BooksUpdatedCounter: It counts how many books are updated.TotalBooksUpDownCounter: Total number of books that the store has at any given time.CategoriesAddedCounter: It counts how many book categories are added to the store.CategoriesDeletedCounter: It counts how many book categories are deleted from the store.CategoriesUpdatedCounter: It counts how many book categories are updated.TotalCategoriesGauge: Total number of book categories that the store has at any given time.OrdersPriceHistogram: Shows the price distribution of the orders.NumberOfBooksPerOrderHistogram: Shows the number of books distribution per order.OrdersCanceledCounter: It counts how many orders has been cancelled.TotalOrdersCounter: Total number of orders that the store has at any given time.
It is possible to test any custom metrics you create using the Microsoft.Extensions.Diagnostics.Testing NuGet package and the MetricCollector implementation.
The MetricCollector class makes it easy to record the measurements from specific instruments and assert the values were correct.
In the /test folder, there is a Unit test project with a few examples that test that the measurements are correct.
These metrics are generated by the System.Diagnostics.Metrics API and they're natively built-in on .NET framework starting from .NET 8.
Here's the full list of the Meters and Instruments built-in the .NET framework.
To start emitting these metrics on your application, there are two options available:
- Install and configure the
OpenTelemetry.Instrumentation.AspNetCoreNuGet package.
To start using the OpenTelemetry.Instrumentation.AspNetCore package you only need to add the AddAspNetCoreInstrumentation() extension method when setting up the .NET OpenTelemetry component. Here's an example:
builder.Services.AddOpenTelemetry().WithMetrics(opts => opts
        .AddAspNetCoreInstrumentation()
);
This instrumentation library automatically enables all built-in metrics by default. The advantage of using this method is that the AddAspNetCoreInstrumentation() extension simplifies the process of enabling all built-in metrics via a single line of code.
- Manually register the built-in Meters using the
AddMeterextension method.
builder.Services.AddOpenTelemetry().WithMetrics(opts => opts
    .AddMeter("Microsoft.AspNetCore.Hosting")
    .AddMeter("Microsoft.AspNetCore.Server.Kestrel")
    .AddMeter("Microsoft.AspNetCore.Http.Connections")
    .AddMeter("Microsoft.AspNetCore.Routing")
    .AddMeter("Microsoft.AspNetCore.Diagnostics")
    .AddMeter("Microsoft.AspNetCore.RateLimiting")
);
The advantage of using this method is that it allows us to exert more granular control over which of the built-in metrics we want to emit. Additionally, employing the AddMeter() for metric activation eliminates the necessity to depend on the OpenTelemetry.Instrumentation.AspNetCore instrumentation library.
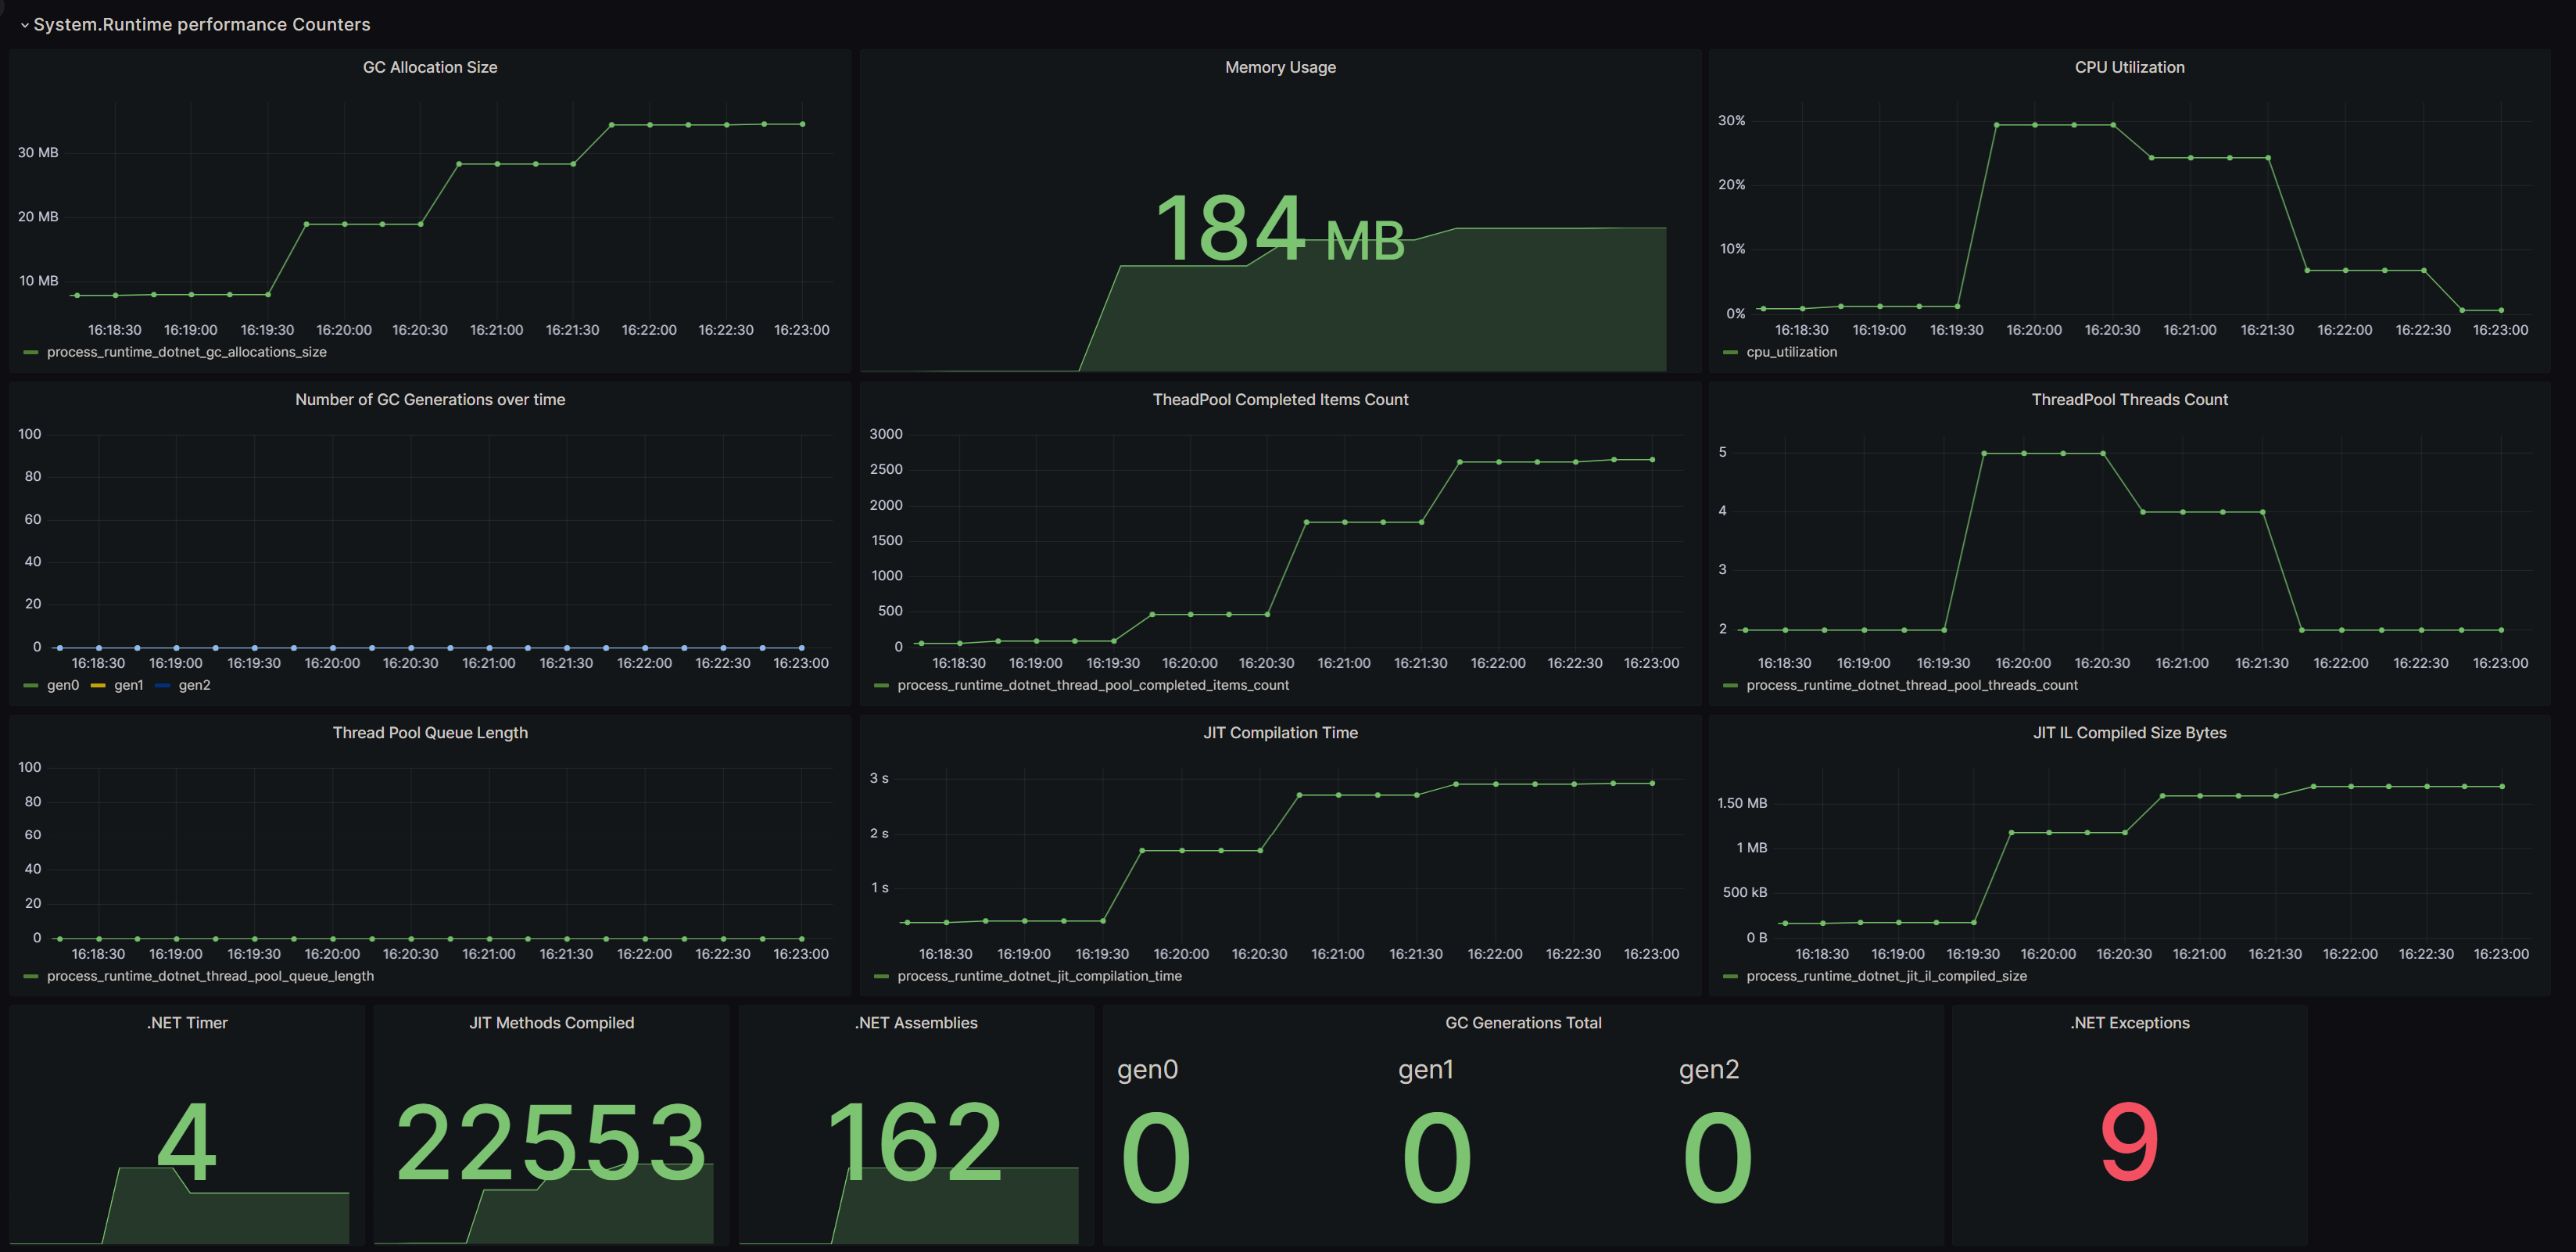
Those metrics are generated by the OpenTelemetry.Instrumentation.Runtime NuGet package. This is an instrumentation library, which instruments .NET Runtime and collect runtime performance metrics.
To start using the OpenTelemetry.Instrumentation.Runtime package you only need to add the AddRuntimeInstrumentation() extension method when setting up the .NET OpenTelemetry component. Here's an example:
builder.Services.AddOpenTelemetry().WithMetrics(opts => opts
    .AddRuntimeInstrumentation()
);
The OpenTelemetry.Instrumentation.Runtime package collects metrics about the following System.Runtime counters:
process.runtime.dotnet.gc.collections.count: Number of garbage collections that have occurred since process start.process.runtime.dotnet.gc.objects.size: Count of bytes currently in use by objects in the GC heap that haven't been collected yet. Fragmentation and other GC committed memory pools are excluded.process.runtime.dotnet.gc.allocations.size: Count of bytes allocated on the managed GC heap since the process startprocess.runtime.dotnet.gc.committed_memory.size: The amount of committed virtual memory for the managed GC heap, as observed during the latest garbage collection.process.runtime.dotnet.gc.heap.size: The heap size (including fragmentation), as observed during the latest garbage collection.process.runtime.dotnet.gc.heap.fragmentation.size: The heap fragmentation, as observed during the latest garbage collection.process.runtime.dotnet.jit.il_compiled.size: Count of bytes of intermediate language that have been compiled since the process start.process.runtime.dotnet.jit.methods_compiled.count: The number of times the JIT compiler compiled a method since the process start.process.runtime.dotnet.jit.compilation_time: The amount of time the JIT compiler has spent compiling methods since the process start.process.runtime.dotnet.monitor.lock_contention.count: The number of times there was contention when trying to acquire a monitor lock since the process start.process.runtime.dotnet.thread_pool.threads.count: The number of thread pool threads that currently exist.process.runtime.dotnet.thread_pool.completed_items.count: The number of work items that have been processed by the thread pool since the process start.process.runtime.dotnet.thread_pool.queue.length: The number of work items that are currently queued to be processed by the thread pool.process.runtime.dotnet.timer.count: The number of timer instances that are currently active.process.runtime.dotnet.assemblies.count: The number of .NET assemblies that are currently loaded.process.runtime.dotnet.exceptions.count: Count of exceptions that have been thrown in managed code, since the observation started.
Some of the GC related metrics will be unavailable until at least one garbage collection has occurred.
Those metrics are generated by the OpenTelemetry.Instrumentation.Process NuGet package. This is an Instrumentation Library, which instruments .NET and collects telemetry about process behavior.
To start using the OpenTelemetry.Instrumentation.Process package you only need to add the AddProcessInstrumentation() extension method when setting up the .NET OpenTelemetry component. Here's an example:
builder.Services.AddOpenTelemetry().WithMetrics(opts => opts
        .AddProcessInstrumentation()
);
The OpenTelemetry.Instrumentation.Process package the following metrics of the running process:
process.memory.usage: The amount of physical memory allocated for this process.process.memory.virtual: The amount of committed virtual memory for this process. One way to think of this is all the address space this process can read from without triggering an access violation; this includes memory backed solely by RAM, by a swapfile/pagefile and by other mapped files on disk.process.cpu.time: Total CPU seconds broken down by states.process.cpu.count: The number of processors (CPU cores) available to the current process.process.threads: Process threads count.
The app uses the following package versions:
<PackageReference Include="OpenTelemetry.Instrumentation.AspNetCore" Version="1.8.1" />
<PackageReference Include="OpenTelemetry.Extensions.Hosting" Version="1.8.0" />
<PackageReference Include="OpenTelemetry.Instrumentation.Runtime" Version="1.8.0" />
<PackageReference Include="OpenTelemetry.Exporter.OpenTelemetryProtocol" Version="1.8.0" />
<PackageReference Include="OpenTelemetry.Instrumentation.Process" Version="0.5.0-beta.5" />- OpenTelemetry Collector
- Prometheus
- MSSQL Server
- Grafana
The repository contains a docker-compose that starts up the BookStore app and also the external dependencies.
The external dependencies (OpenTelemetry Collector, Prometheus, MSSQL Server and Grafana) are already preconfigured so you don't need to do any extra setup.
- The OpenTelemetry Collector is already configured to export the metrics to Prometheus.
- The MSSQL Server comes with the BookStore database schema configured.
- The Prometheus is already configured to receive the metric data from the OpenTelemetry Collector.
- The Grafana has the Prometheus connector already setup, it also contains 3 custom dashboards to visualize the OpenTelemetry metrics emitted by the BookStore app.
Just run docker-compose up and your good to go!
It requires to have cURL installed on your local machine.
This repository contains a seed-data.sh Shell script that will invoke some endpoints of the BookStore API via cURL.
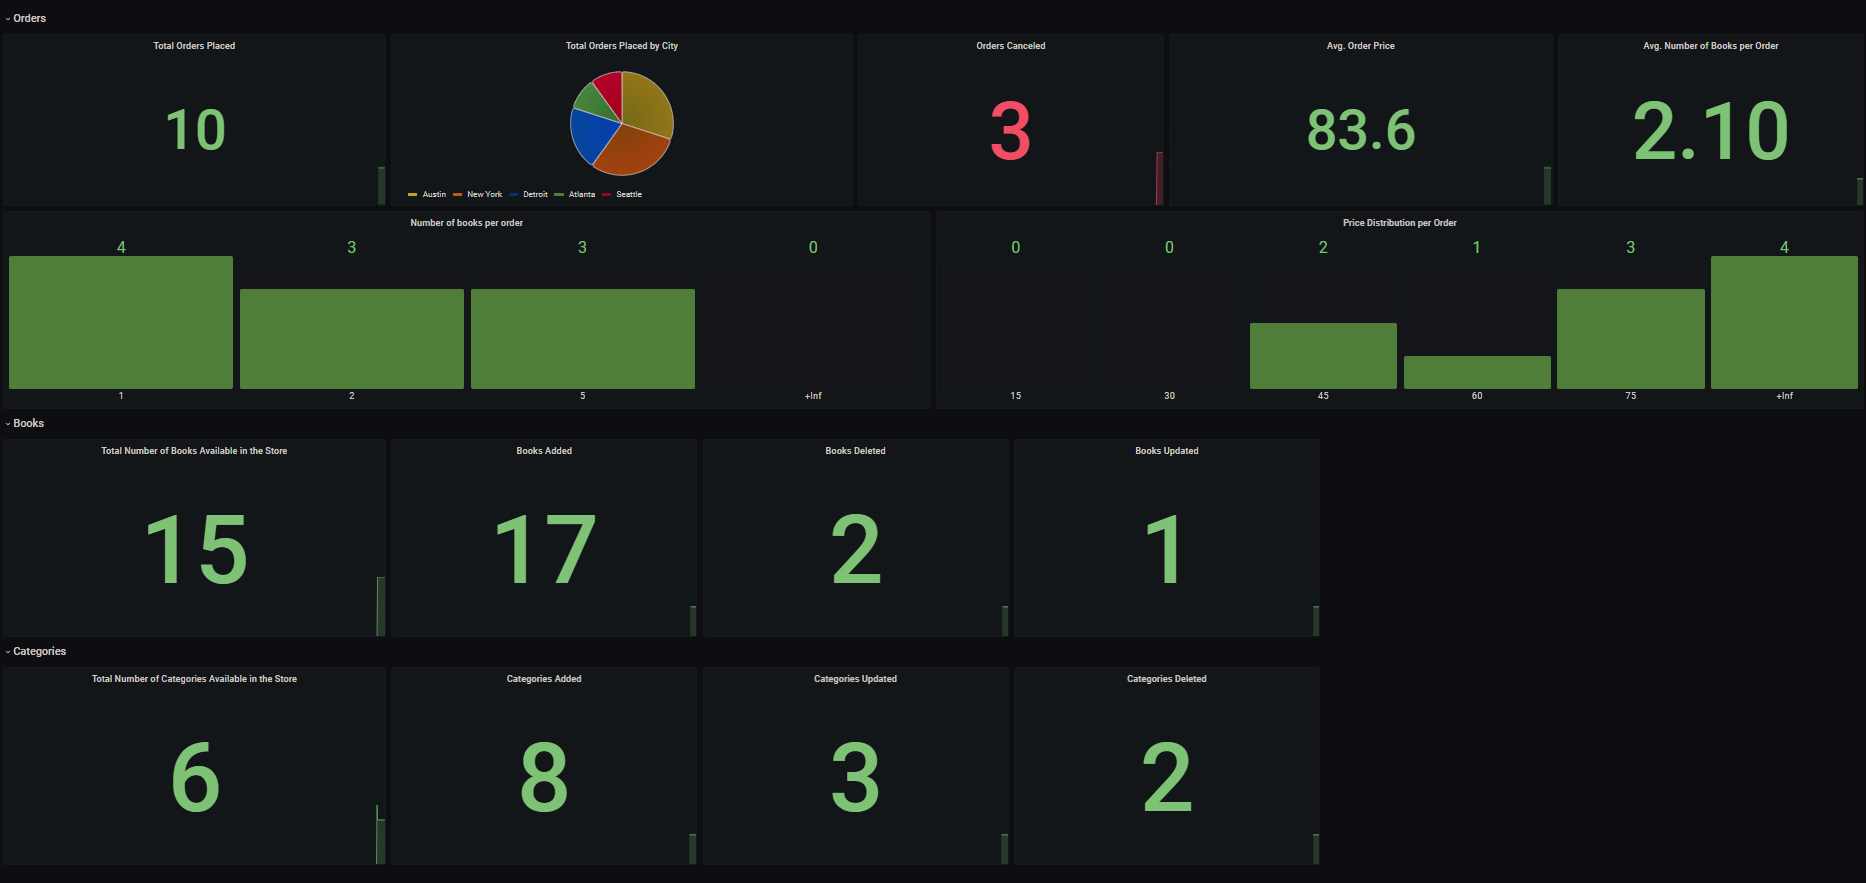
The seed-data.sh script runs the following operations:
- Adds 8 book categories.
- Updates 3 book categories.
- Deletes 2 book categories.
- Adds 17 books into the store.
- Updates 4 existing books.
- Deletes 2 existing books.
- Adds inventory for every book on the store.
- Creates 10 orders.
- Cancels 3 existing orders.
The purpose behind this script is to generate a decent amount of metrics that later can be visualized in Grafana.
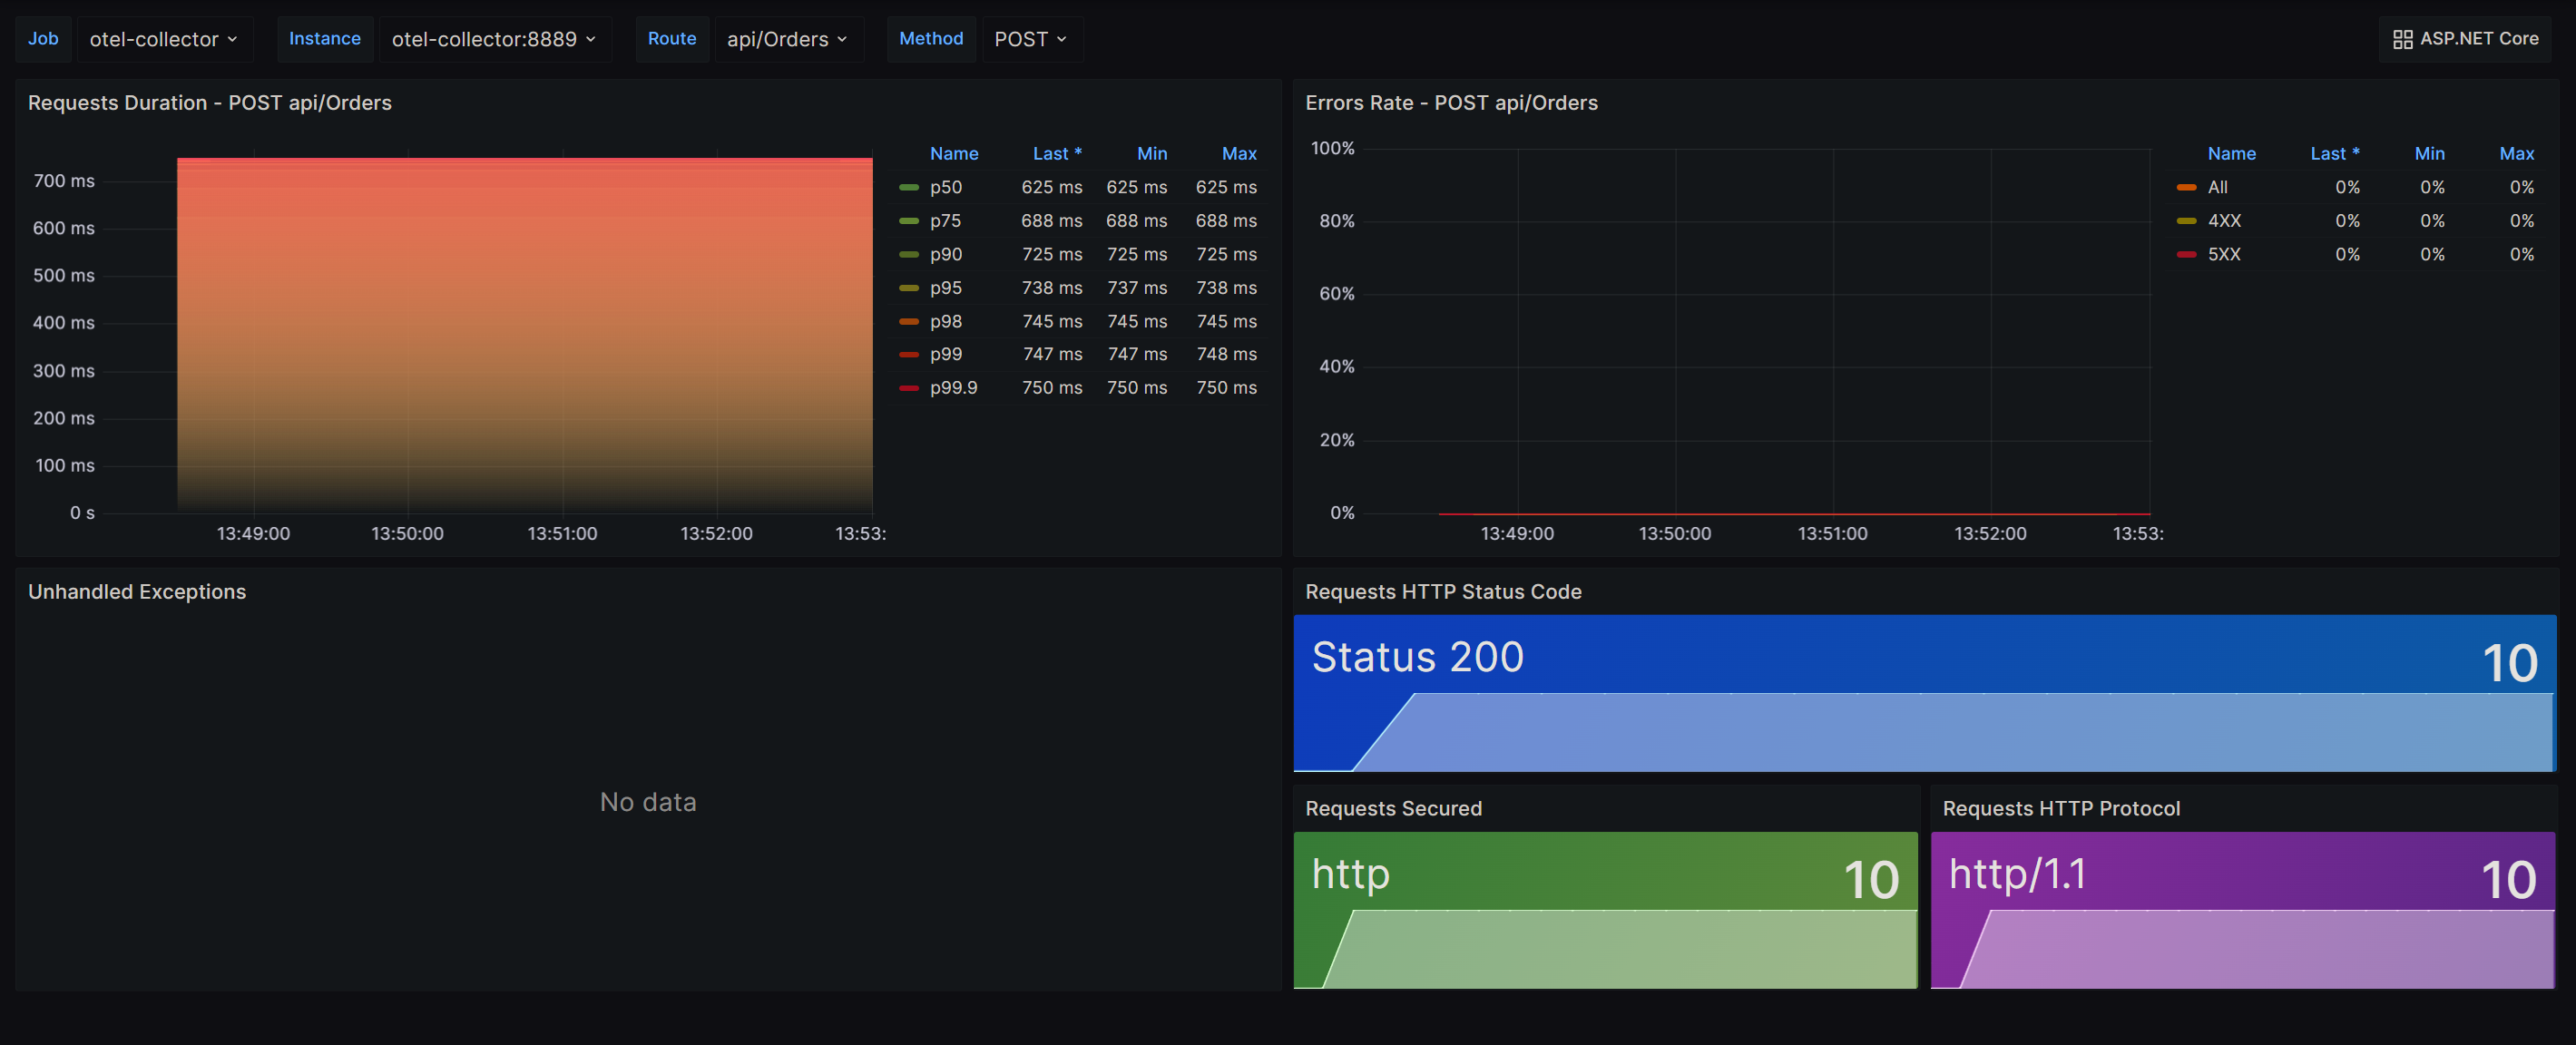
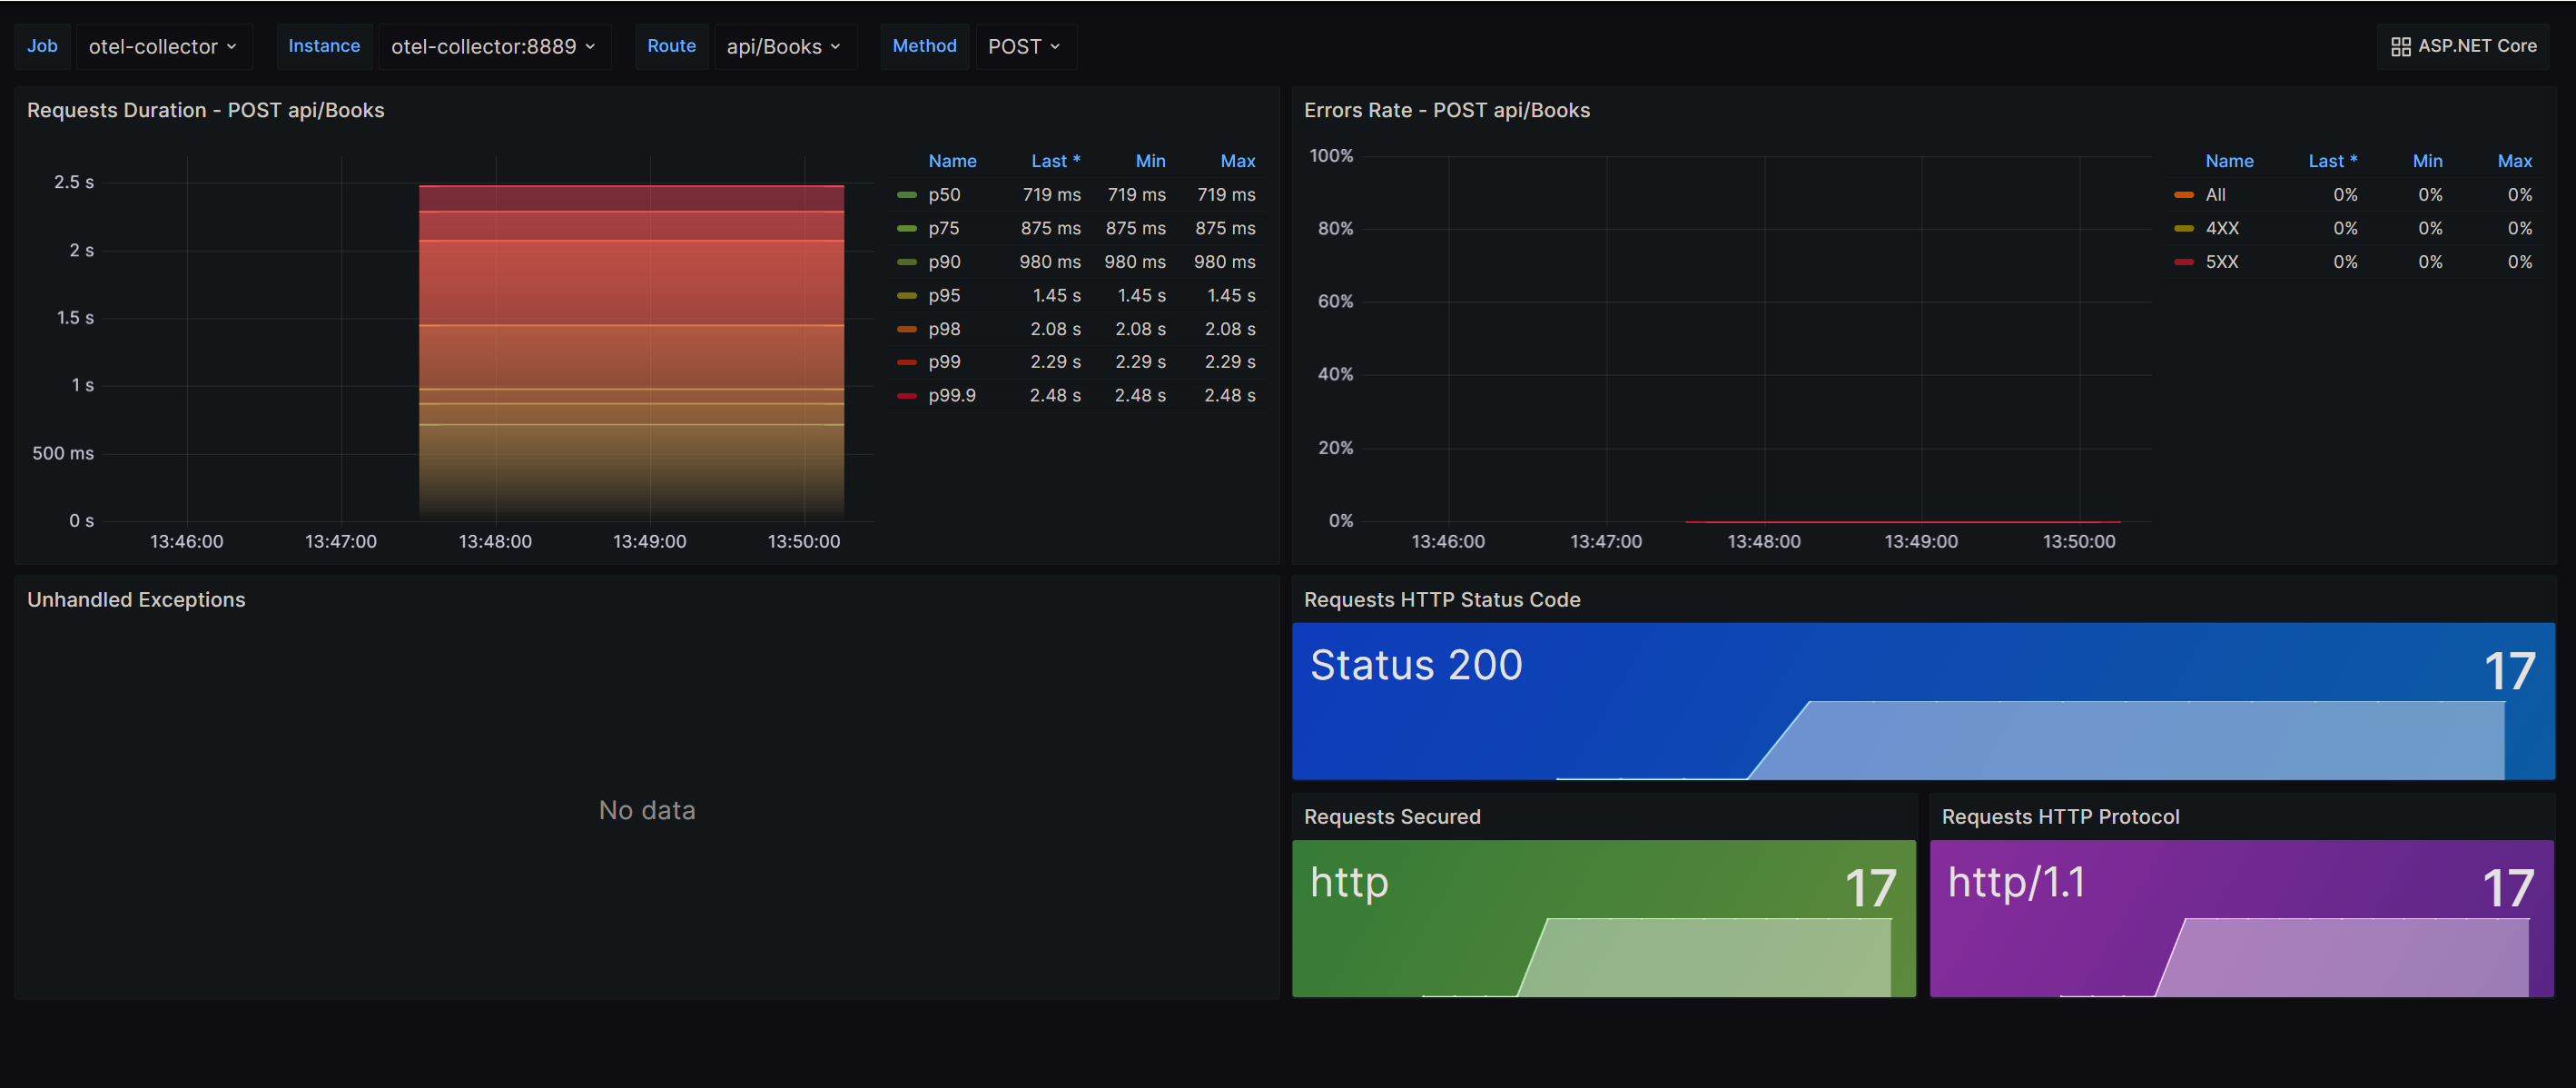
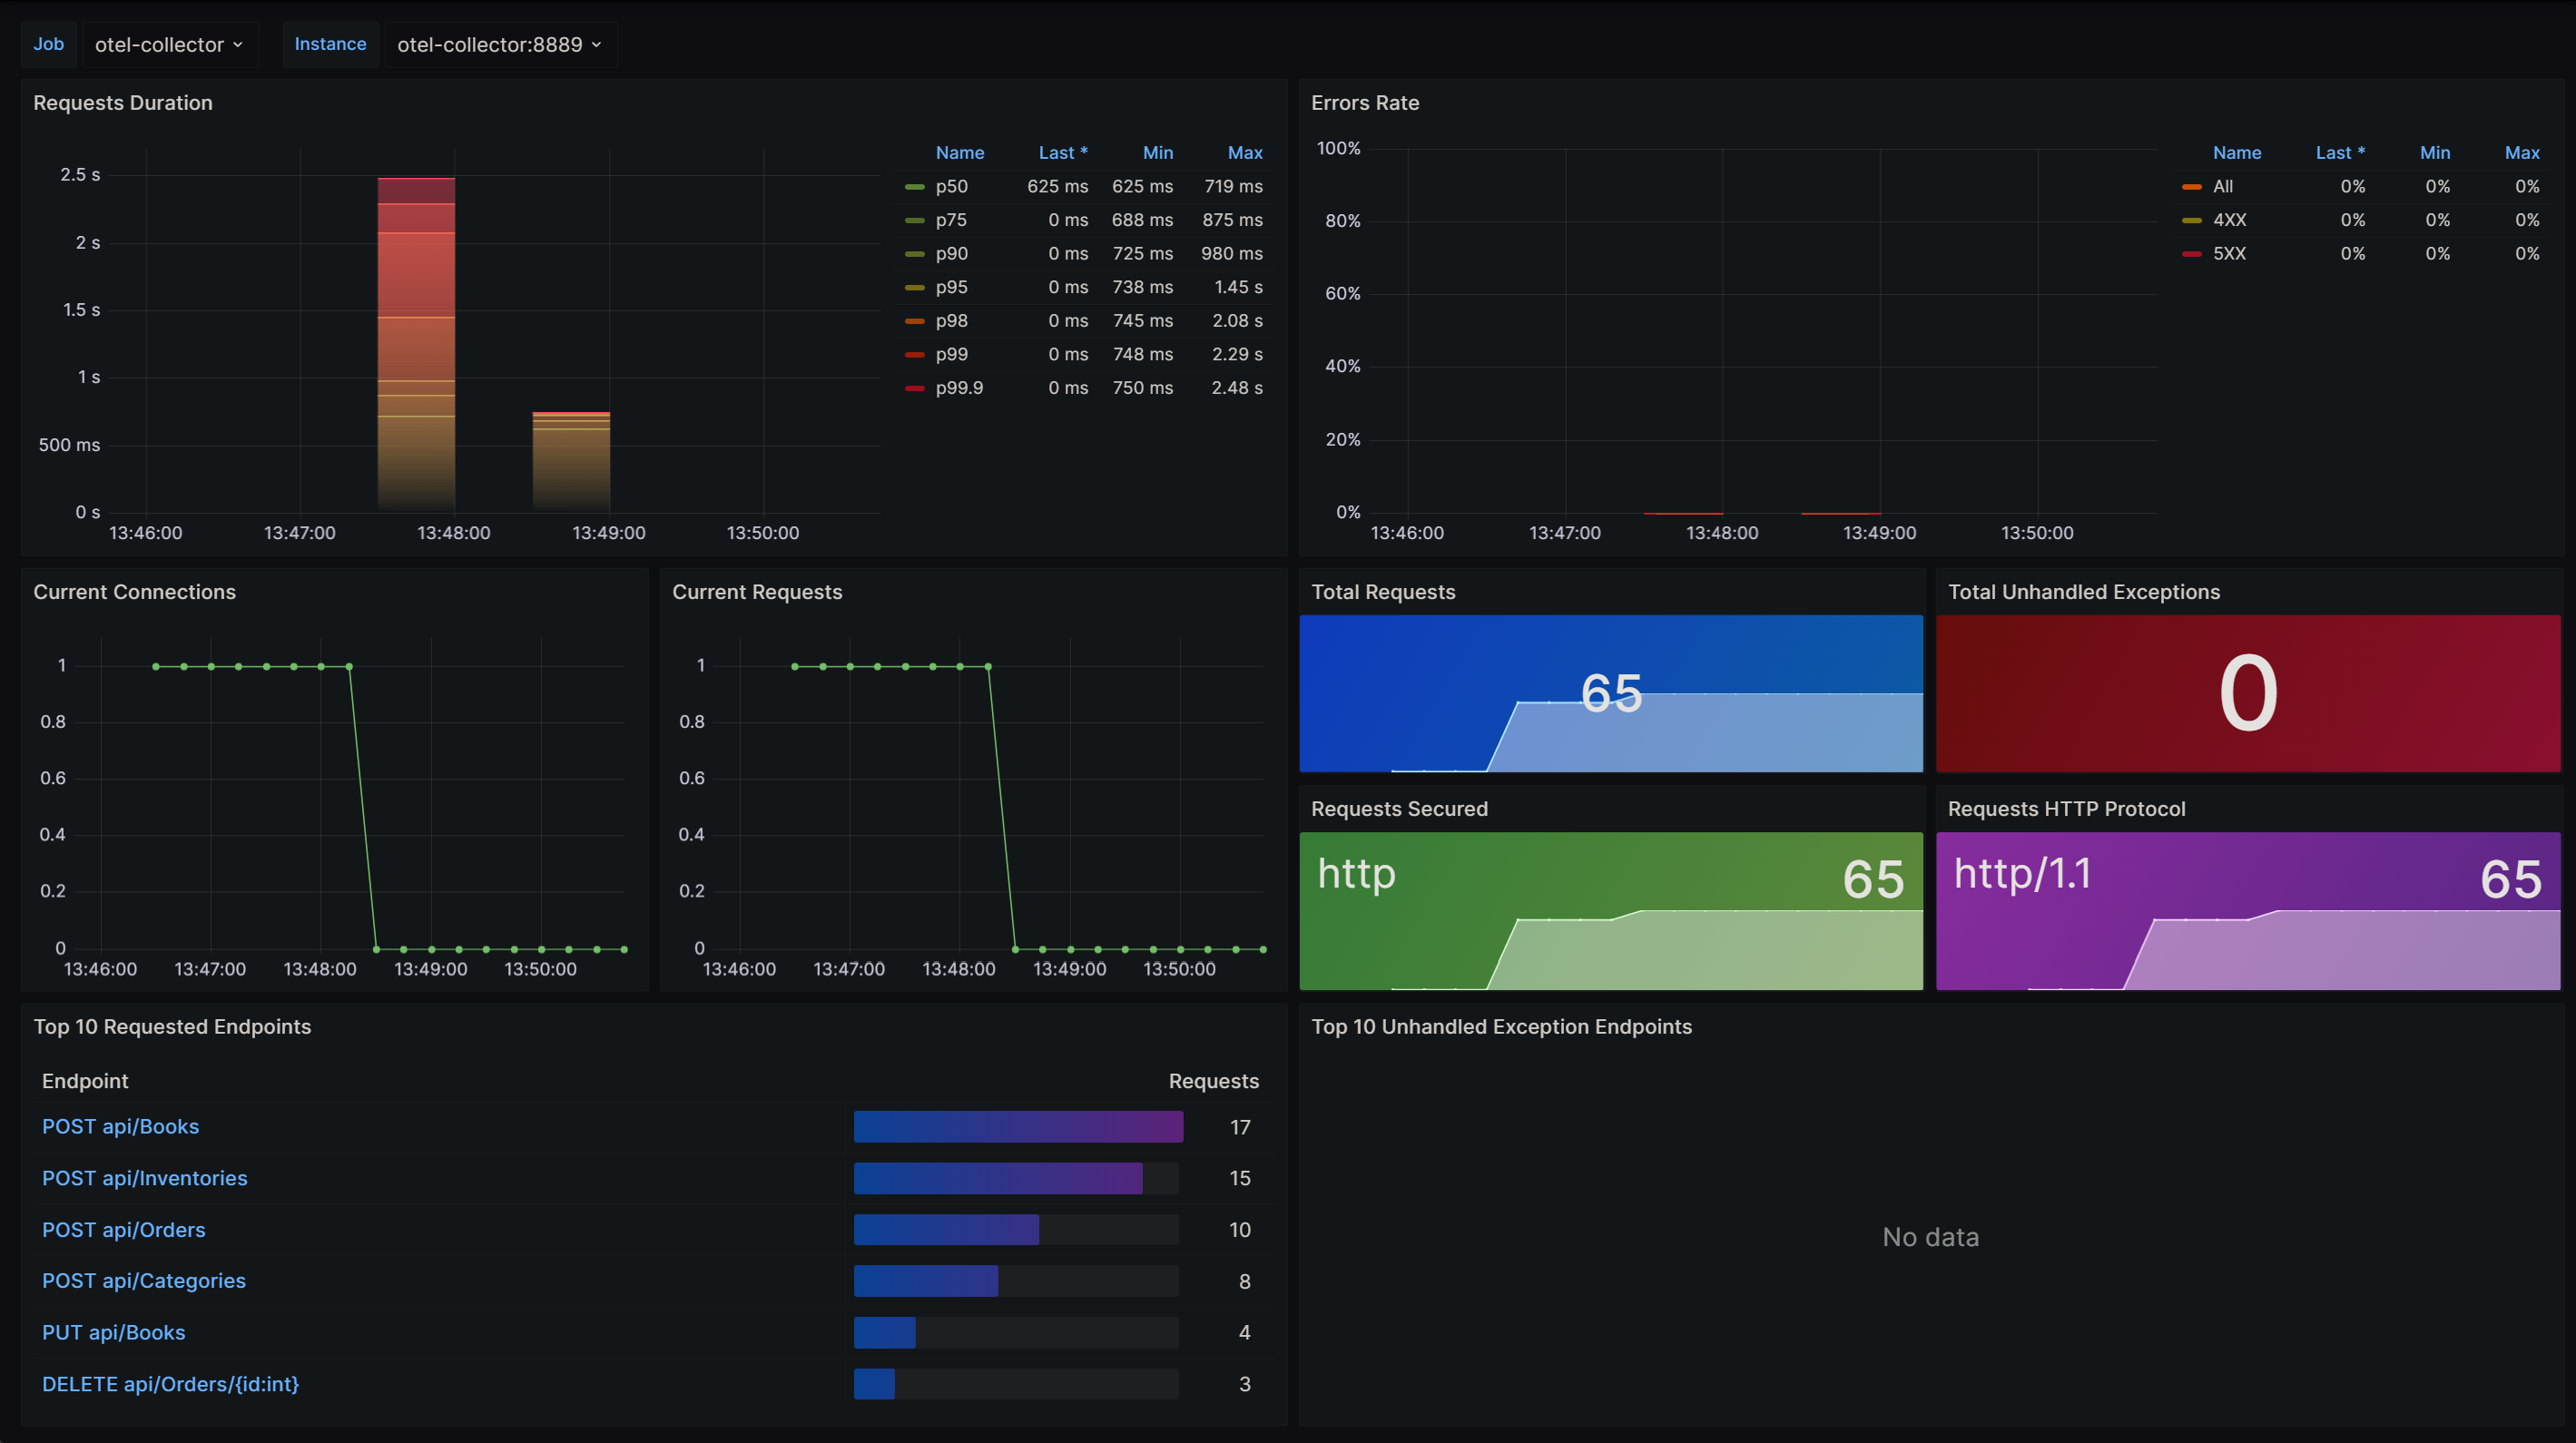
If you open Grafana, you're going to see those 3 dashboards.
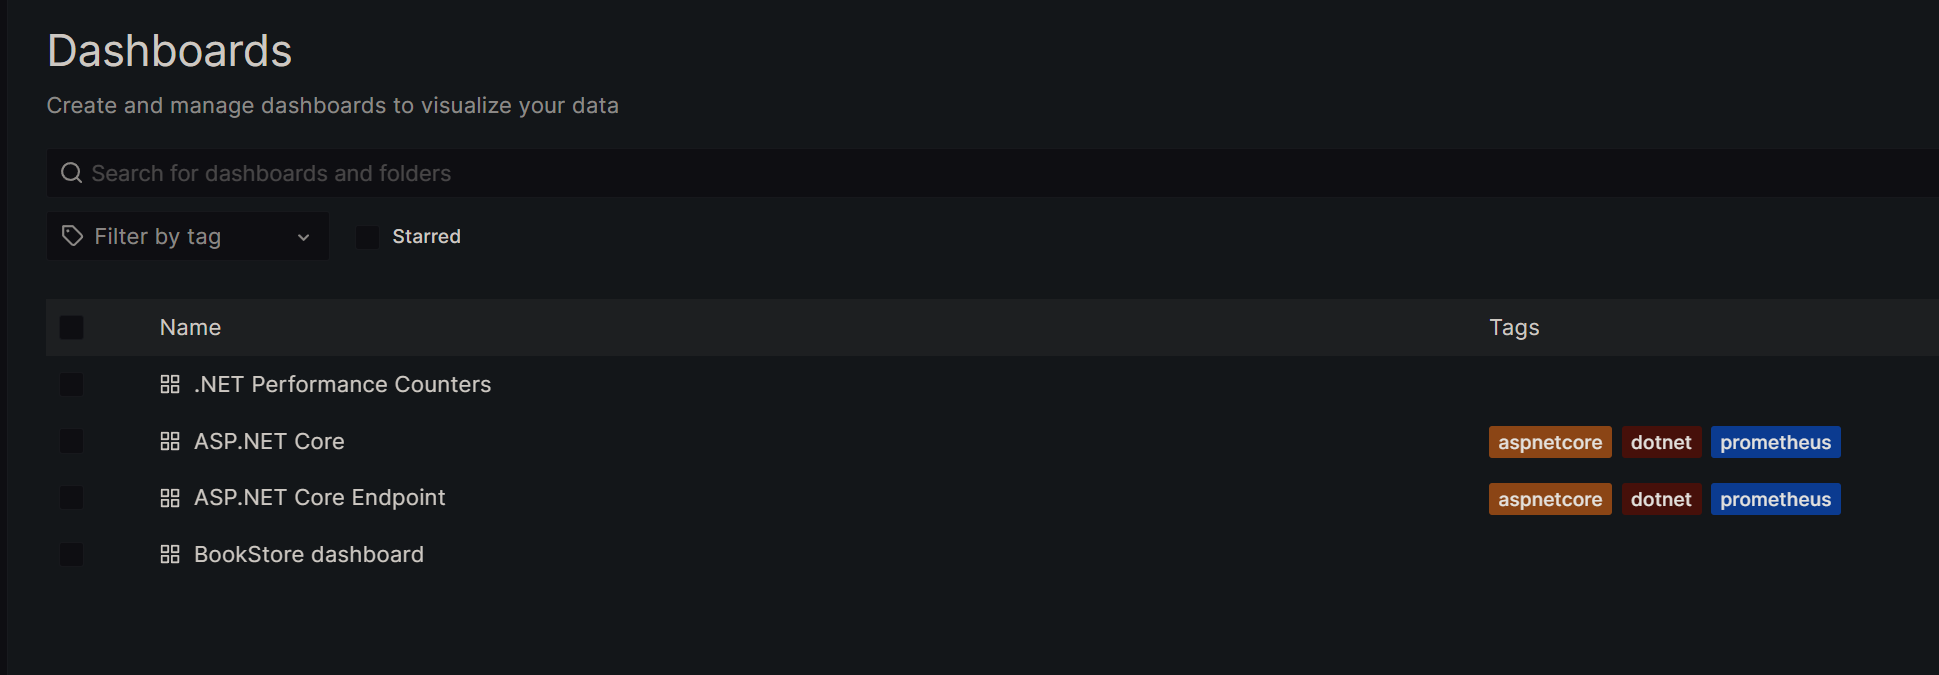
If you open those dashboards after running the seed-data.sh script from the previous section, you're going to see something like this.
This pair of dashboards were not built by me; they were built by the .NET team themselves. I simply downloaded them and included them in this repository so that when you run docker-compose up, they are already included in the example, and you don't need to import them.
If you want to play around with them on your own, the link to download them is as follows: link
- Update
OpenTelemetrypackages to remove known security vulnerabilities. - Remove the
AutoMapper.Extensions.Microsoft.DependencyInjectionpackage because it has been deprecated. And instead installAutoMapper 13.0.0. - Update
EntityFrameworkpackages to the latest stable version.
- Update application to .NET 8.
- The application now uses an Ubuntu Chiseled base image instead of a Debian one.
- Rename the
OtelMetricsclass toBookStoreMetrics. - The
BookStoreMetricsclass uses the newIMeterFactoryinterface to create theMeter. - Move the
Metername from being a hardcoded string to configuration. - Add some new C# 12 features like primary constructors and collection expressions.
- Update OpenTelemetry packages to the latest version.
- Create a Unit Test project to demonstrate how can we test the
Instrumentsusing theMicrosoft.Extensions.Diagnostics.Testinglibrary and theMetricCollector. - Update Grafana, Prometheus and OTEL Collector images used on the docker-compose to the most recent versions.
- Fix a few broken panels on the Grafana dashboards due to the upgrade.
- Deleted the custom dashboard that uses ASP.NET core metrics and replaced it with the two new ones built by the .NET team itself. They can be found in the Grafana Store. Here's the link
- Update application to .NET 7.
- Add a new middleware into the app that simulates latency.
- Update OpenTelemetry packages to the latest version.
- Fix breaking changes on the app due to the OpenTelemetry packages version upgrade.
- Fix a few broken panels on the Grafana dashboard due to the OpenTelemetry packages version upgrade.
- Install and configure
OpenTelemetry.Instrumentation.Processpackage to import CPU and memory metrics. - Replace the
TotalBooksGaugemetric with theTotalBooksUpDownCountermetric. - Update Grafana, Prometheus and OTEL Collector images used on the docker-compose to the newest versions.