Plot 2d with pyvista #5992
-
|
Hi, is it possible to realize a classical 2d contour plot with pyvista? If it is possible how can I do? (I can add my code if needed). |
Beta Was this translation helpful? Give feedback.
Replies: 2 comments 3 replies
-
|
Please refer code in this link. |
Beta Was this translation helpful? Give feedback.
-
|
Hi tkoyama010, thank you for your reply. |

Beta Was this translation helpful? Give feedback.
-
|
You can find instructions on how to add contour lines to a mesh here. |
Beta Was this translation helpful? Give feedback.
-
|
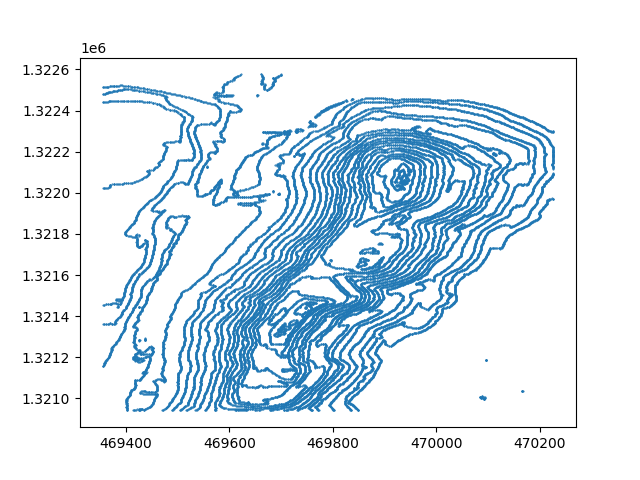
Thank you tkoyama010, however I would like to know if there is the possibility to obtain a plot like this with pyvista |

Beta Was this translation helpful? Give feedback.
-
|
You can show the bounds axis using the import pyvista as pv
from pyvista import examples
mesh = pv.Sphere()
plotter = pv.Plotter()
actor = plotter.add_mesh(mesh)
actor = plotter.show_bounds(
grid='front',
location='outer',
all_edges=True,
)
plotter.enable_parallel_projection()
plotter.show(cpos="xy")
|

Beta Was this translation helpful? Give feedback.
You can show the bounds axis using the
show_boundsmethod. Seeshow_boundsmethod API document for more detail.(Edit: To make a 2D view, you can control
cposarg in the show method. Seeshowmethod API document for more detail. Also,enable_parallel_projectionis also useful to make it a 2D view.)